Stress-Test Apache with Intent to Tune: BSOFH Tip for the Software Masochist
Posted August 28th, 2009 by rybolovSo I’ve been having some problems with my server for a month or so–periodically the number of apache servers would skyrocket and the box would get so overloaded (load of ~50 or so) that I couldn’t even run simple commands on it. I would have to get into the hardware console and give the box a hard boot (a graceful reboot wouldn’t work).
Root cause is I’m a dork, but more about that later.
Anyway, I needed a way to troubleshoot and fix it. The biggest problem I had was that the problem was very sporadic–sometime it would be 2 weeks between crashes, other times it would be 3 times in one day. This is so begging for a stress-test really badly. Looking on the Internet, I found a couple of articles about running a load-tester on apache and information on the tuning settings but not really much about a methodology (yeah yeah I work for a Big 4 firm, the word still makes me shudder even though it’s the right one to use here) to actually solve the problem of apache tuning.
So the “materials” I needed:
- One server running apache. Mine runs Apache2 under Debian Stable. This is a little bit different from the average distro out there in that the process is apache2 and the command is apache2ctl where normally you would have httpd and httpdctl. If you try this at home, you’ll need to use the latter commands.
- An apache tuning guide or 3. Here’s the simplest/most straightforward one I’ve seen.
- A stress-tester. Siege is awesome for this.
- Some simple shell commands: htop (top works here too), ps, grep, and wc.
Now for the method to my madness…
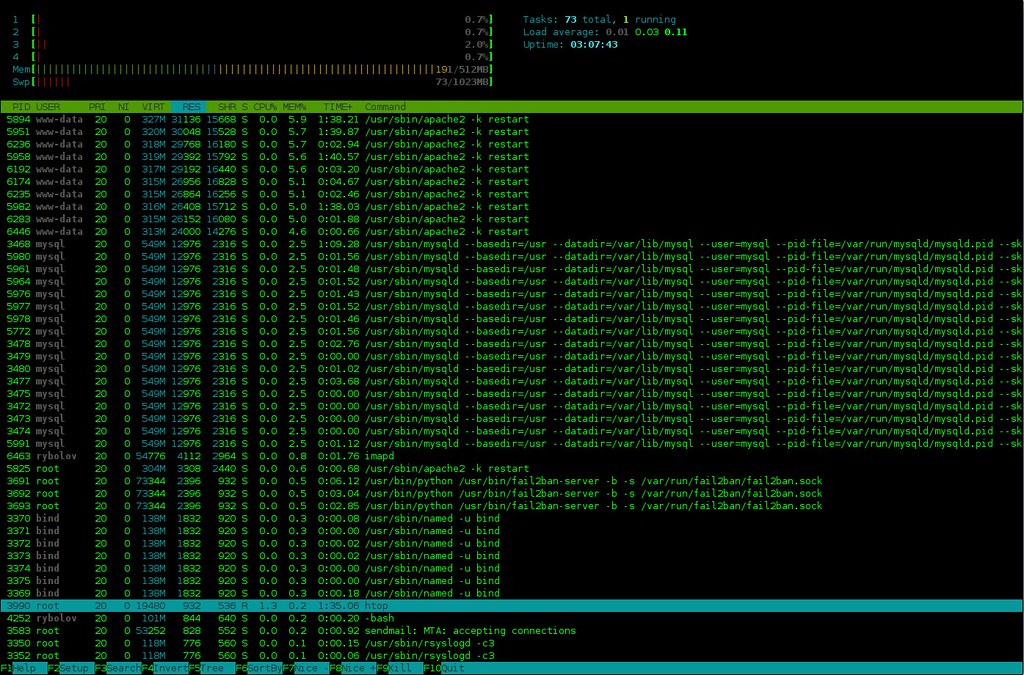
I ssh into my server using three different sessions. On one I run htop. Htop is a version of top that gives you a colored output and supports multiple processors. The output without stress-testing looks something like this:
I keep one session free to edit files and do an emergency “killall apache2” if things get out of hand (and they will really quickly, I had to pull the plug about 20 times throughout this process). I run a simple command on another ssh session to get a count of how many apache threads I have running:
rybolov@server:~$ ps aux | grep apache2 | grep start | wc -l
11
OK, so far so good. I’ve got 11 threads running with no load and RAM usage of 190MB. I needed the extra “grep start” because it removes the text editor I have open on apache2.conf and anything else I might be doing in the background.
I also killed apache, waited 10 seconds, and looked at the typical RAM use. With no apache running, I use about 80MB just for the OS and everything else I’m running. This means that I’m using 110MB of RAM for 11 apache threads, which means I’m using ~10MB of RAM for each apache thread. Now that’s something important I can use.
I took my tuning settings in apache2.conf (httpd.conf for most distros) (Apache2 uses the prefork module which uses threads, read the tuning guide for more info) and set them at the defaults listed in the tuning guide. They became something like the following:
<IfModule prefork.c>
  StartServers            8
  MinSpareServers         5
  MaxSpareServers        20
  MaxClients            150
  MaxRequestsPerChild  1000
</IfModule>
Notice how the MaxClients is set at 150? This will prove to be my downfall later. Turns out that my server is RAM-poor for as much processor as it has or WordPress is a RAM hog (or both, which is the case =) ). I’ll eventually upgrade my server, but since it’s a cloud server from Mosso, I pay by the RAM and drive space.
After each edit of apache2.conf, you need to give apache a configuration test and reload:
server:~# apache2ctl configtest
Syntax OK                        <- If something else comes back, fix it!!
server:~# apache2ctl restart
I’m now ready to stress-test using the default setup. This is the awesome part. First, I need to simulate a load. I make an url seedfile so that siege will bounce around between a handful of pages. I make a file siege.urls.txt and put in a collection of urls so that it looks like the following:
http://www.guerilla-ciso.com/
http://www.guerilla-ciso.com/about
http://www.guerilla-ciso.com/contact
http://www.guerilla-ciso.com/papers-and-presentations
....<about 20 lines deleted here, you get the point>
http://www.guerilla-ciso.com/page/2
http://www.guerilla-ciso.com/page/3
http://www.guerilla-ciso.com/page/4
I’m sure there is an efficient and fun way to make this, like say, a text-only sitemap or sproxy which is made by the same guy who does siege, but since I only needed about 30 urls, I just cut-n-pasted them off the blog homepage.
I fire up siege and give my webserver a thorough drubbing, running 50 connections for 10 minutes and using my url seedfile. BTW, I’m running siege on the webserver itself, so there isn’t anything in the way of network latency. <enter sinister laugh of evil as I sadistically torture my apache and the underlying OS>
server:~# siege -c 50 -t 600s -f siege.urls.txt
** SIEGE 2.66
** Preparing 50 concurrent users for battle.    <-The guy writing siege has a wicked sense of humor.
The server is now under siege...                <-Man the ramparts, Apache, they're coming for you!
HTTP/1.1 200   1.08 secs:   16416 bytes ==> /
HTTP/1.1 200   1.07 secs:   16416 bytes ==> /
....<about 2 bazillion lines deleted here, you get the idea>
HTTP/1.1 200   4.66 secs:    8748 bytes ==> /about
HTTP/1.1 200   3.92 secs:    8748 bytes ==> /about
Lifting the server siege...      done.

Transactions:                  61 hits   <-No, this isn't actual, I abbreviated the siege output
Availability:              100.00 %      <-with a ctrl-c just to get some results so I didn't
Elapsed time:                6.70 secs   <-have to scroll through all that output from the real test.
Data transferred:            0.87 MB
Response time:                3.27 secs
Transaction rate:            9.10 trans/sec
Throughput:                0.13 MB/sec
Concurrency:               29.75
Successful transactions:          61
Failed transactions:               0
Longest transaction:            5.61
Shortest transaction:            1.07
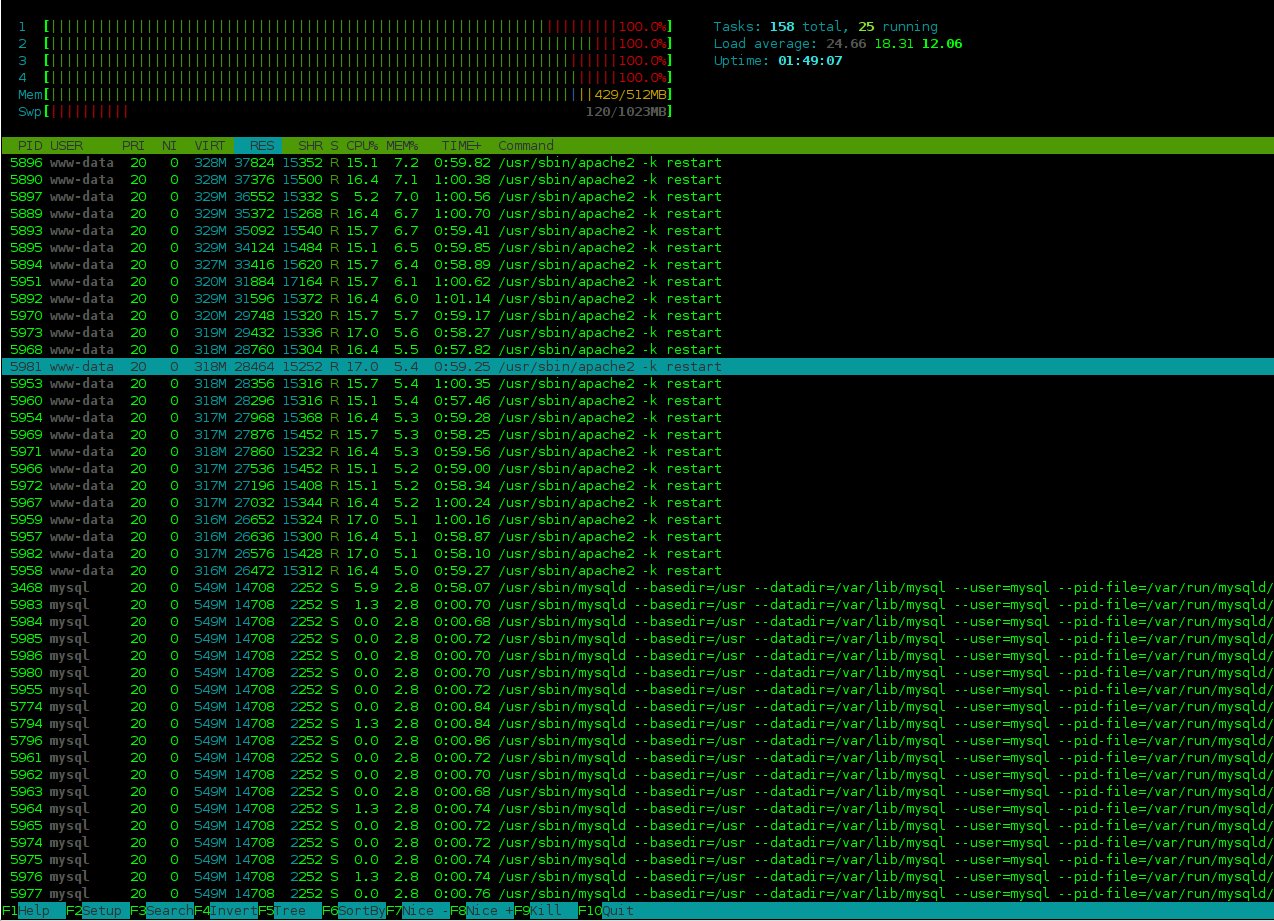
Now I watch the output of htop. Under stress, the output looks something like this:
(Click for a life-size image)
Hmm, looks like I have a ton of apache threads soaking up all my RAM. What happens is that in about 30 seconds, the OS starts swapping and the swap use just keeps growing until the OS is unresponsive. This is a very interesting cascade failure because writing to swap incurs a load which makes the OS write to swap more. Maybe I need to limit either the amount of RAM used per apache or limit the maximum amount of threads that apache spawns. The tuning guide tells us how…
There is one setting that is the most important in tuning apache, it’s MaxClients. This is the maximum number of servers (with the worker module) or threads (prefork module). Looking at my apache tuning guide, I get a wonderful formula: ($SizeOfTotalRAM – $SizeOfRAMForOS) / $RAMUsePerThread = MaxClients. So in my case, (512 – 80) / 11 = 39.something. Oops, this is a far cry from the 150 that comes as default. I also know that the RAM/thread number I used was without any load on apache, so with a load on and generating dynamic content (aka WordPress) , I’ll probably use ~15MB per thread.
One other trick that I can use: Since I think that what’s killing me is the number of apache threads, I can run with a reduced amount of simultaneous connections and watch htop. When htop shows that I’ve just started to write to swap, I can run my ps command to find out how many apache threads I have running.
rybolov@server:~$ ps aux | grep apache2 | grep start | wc -l
28
Now this is about what I expected: With 28 threads going, I tipped over into using swap. Reversing my tuning formula, I get (28 threads x 15 MB/thread) +80 MB for OS = 500 MB used. Hmm, this makes much sense to me, since the OS starts swapping when you use ~480MB of RAM.
So I go back to my prefork module tuning.
<IfModule mpm_prefork_module>
 StartServers          8
 MinSpareServers       5
 MaxSpareServers      10
 MaxClients           25
 MaxRequestsPerChild   2000
</IfModule>
I set MaxClients at 25 because 28 seems to be the tipping point, so that gives me a little bit of “wiggle room” in case something else happens at the same time I’m serving under a huge load. I also tweaked some of the other settings slightly.
Then it’s time for another siege torture session. I run the same command as above and watch the htop output. With the tuning settings I have now, the server dips into swap about 120MB and survives the full 10 minutes. I’m sure the performance is degraded somewhat by going into swap, but I’m happy with it for now because the server stays alive. It wasn’t all that smooth, I had to do a little bit of trial and error first, starting with MaxClients 25 and working my way up to 35 under a reduce siege load (-c 25 -t 60s) to see what would happen, then increasing the load from siege (-c50 -t 600s) and ratcheting MaxClients back down to 25.
And as far as me being a dork… well, aside from the huge MaxClients setting (That’s the default, don’t blame me), I set MaxRequestsPerChild to 100 instead of 1000, meaning that every 100 http requests I was rolling over and making a new thread. That would lead to cascade failure under a load. (duh!)
Similar Posts:
Posted in Technical, The Guerilla CISO, What Works |  5 Comments »
 Posts RSS


